Data Hacking and Coffee
This past week a coworker of mine and I decided to make coffee for everyone at our office as a hackathon project. The real project led to data analysis on coffee tastings, or “cuppings”, with the end goal to expose the best coffees for us at work, focused on the most common brewing methods available in our office. In any case, it ended up being a really fun project, with some dramatic learnings about the simple value of yes/no questions in data collection.
Preparation
We built a small front end web app using Meteor to store tastings data in MongoDB. Over the course of two mornings, we grinded and brewed roughly 36 oz of our 48 oz of beans, about 80 data samples in total. Given our Stumptown preferences at the office, we trialled four of their beans:
- Hair Bender (blend)
- Holler Mountain (blend)
- Indonesia Sulawesi Toarco Toraja (single origin)
- Guatemala Finca El Injerto (single origin)
Each bean was brewed three different ways:
- Espresso (just shots, no milk or extra water)
- Pour over
- AeroPress
Each cup (4 beans x 3 methods = 12 cups) had a thumbs up/thumbs down for four impressions:
- overall taste,
- aroma,
- acidity,
- and body
Then, out of 25 picked words from assorted websites that describe flavors of coffee, each taster picked as many words as they wanted to describe their tasting. They didn’t know what bean they were trying, but were informed around brewing methods each day.
You can follow along the user experience, including all the words we used, here.
Analysis
Initially, I wanted to identify the value of a flavor, broken down by each impression type (0 to 1). To find an answer, I grouped cuppings by flavor and broke down the appropriate scores by averaging each impression.
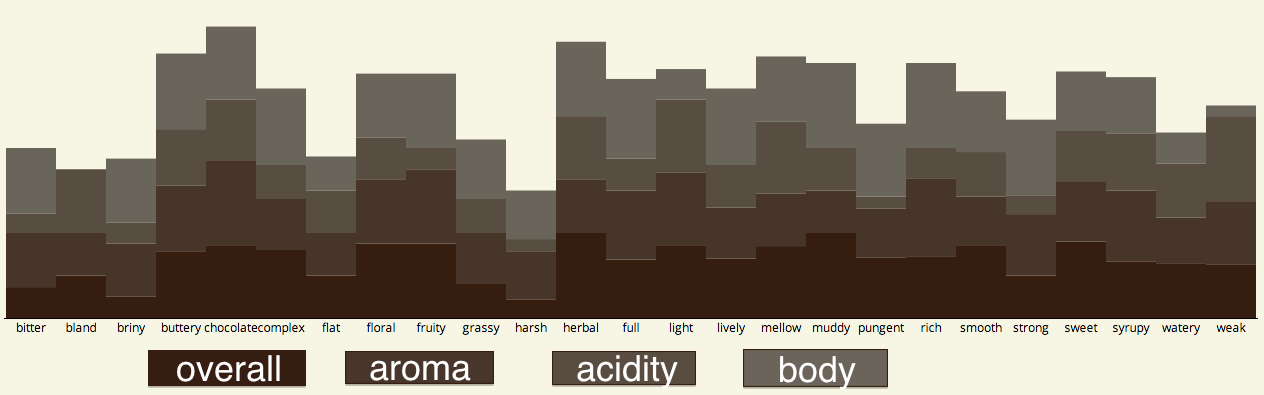
On the results page (or the image above), the stacked bar graph represents “overall”, “aroma”, “acidity”, and “body” (from dark brown to light brown, or bottom to top) for each possible flavor word. For example, chocolate got a near perfect score in all areas, and seemed to be the most favorable flavor. Bland scored very poorly, with a body score of practically 0. Pungent scored generally okay across all flavors, except “acidity,” which scored very low. In general, I’d base impressions/flavors this way:
- A “positive” impression: score of .7 or above (large rectangle)
- A “neutral” impression: score of .4 to .6 (square rectangle)
- A “negative” impression: score of .3 or below (small-nil rectangle)
I then determined which words best described which beans. I decided to use tf-idf, namely for its ability to (hopefully) find uniqueness of words in a given document; in this case, cuppings specific to a bean. This approach let me see how often words were used to describe beans, but also how often those same words were used to describe other beans as well. For example, bitter could have easily described all the beans, so it would have had a low uniqueness score for each bean. In the results, I found it interesting that even with the inverse counterweight, harsh still showed up for two different beans.
Tf-idf wasn’t too difficult to implement in JavaScript, though I conjoined with it a sorted object function commonly seen on StackOverflow. Code here (on Github, early on, in the coffeeMoto namespace):
generateUniques: function(cupping_array) {
  var tf_idf = {};
  Tastings.find().forEach(function(i) {
    total = Cuppings.find().count();
    t = Cuppings.find({
      'cup' : {$in : cupping_array},
      'tastes' : i.taste
    }).count();
    d = Cuppings.find({'tastes' : i.taste}).count() + 1;
    idf = Math.log(total/d);
    tf_idf[i.taste] = idf * t;
  })
  var sortable = [];
  for (var word in tf_idf) {
    sortable.push([word, tf_idf[word]]);
    sortable.sort(function(a, b) {return a[1] - b[1]});
  }
  unique_limit = []
  [1, 2, 3].forEach(function(i){
    unique_limit.push(sortable[sortable.length - i][0])
  })
  return unique_limit;
}
Bean Results
Given the top three words that defined each bean, I used the impressions and flavor scores to see which bean had the most favorable tastes:
- Holler Mountain won best espresso for its favored smooth and buttery flavor.
- Hair Bender won top AeroPress brew, mostly for its unique complex flavors contained in a light brew.
- Indonesia Sulawesi Toarco Toraja won for pour over, based on the very powerful but earthy “in your face” taste many of us found it to have.
- Guatemala Finca El Injerto came out on top as the favorite in the office, but primarily due to the fact that it tasted great independent of brewing method.
Conclusions
Never forget the power of simple yes/no questions in your application. Simply by having colleagues describe coffee and give a thumbs up or down, I was able to (very roughly) generate incredibly useful data for future coffee direction in the office. And I think eventually, we’ll find our buttery chocolate herbal coffee bean (that is, until our tastes change).
You can find all the code on Github.